
A lower purchase price does not always mean a cheaper motor. If you are asking, “How do I compare electric motor lifetime costs?” the useful answer starts with the work the motor must perform—not the price on the quotation. Energy consumption, operating hours, maintenance, downtime, and replacement timing can change which option delivers the best value.
For engineers, procurement teams, and facility managers, a fair comparison also needs realistic load profiles, electricity tariffs, and drive compatibility. The goal is not simply to buy the highest efficiency rating. It is to select a motor that meets the application’s requirements at the lowest credible total cost of ownership.
Start with the same job, not just the same power rating
Two motors with identical rated output are not automatically interchangeable. Before comparing costs, confirm that both can deliver the required torque, speed, starting performance, and duty cycle under actual site conditions.
A motor that costs less but requires foundation changes, additional cooling, or an incompatible drive may lose its apparent advantage before production begins. Equally, a more efficient motor is not a good investment if its enclosure or thermal capability is unsuitable for the environment.
Build the comparison around a common specification:
- Mechanical requirements: shaft output, operating speed, torque profile, mounting arrangement, and coupling dimensions.
- Electrical requirements: supply voltage, frequency, starting method, and variable-frequency drive requirements.
- Operating conditions: ambient temperature, altitude, contamination, moisture, and hazardous-area requirements where applicable.
- Duty: continuous operation, intermittent running, frequent starts, or variable-speed service.
Use the same study period for every option. If one motor is expected to need replacement during that period, include the replacement and installation costs rather than shortening its comparison window.
Build a lifetime-cost model you can explain
A practical electric motor life-cycle cost model includes more than purchase and electricity:
Lifetime cost = purchase and installation + energy + maintenance + expected downtime + replacements + disposal − residual value.
For a multiyear investment, discount future costs to their present value. This allows you to compare money spent today with expenses incurred several years later:
Present-value cost = initial installed cost + Σ[Ct ÷ (1 + r)t] − discounted residual value.
Here, Ct represents costs in year t, and r is the annual discount rate. Include disposal costs in the relevant year. Use nominal costs with a nominal discount rate, or constant-price costs with a real discount rate; mixing the two distorts the result.
Label uncertain inputs as assumptions. A transparent estimate is more useful than an impressive-looking spreadsheet built on unexplained figures.
Calculate energy consumption from the load profile
For many heavily used motors, electricity is the largest lifetime expense. However, multiplying rated power by annual hours can give a misleading answer because the nameplate rating describes mechanical output capacity, not actual electrical input.
For a steady operating point:
Annual energy use (kWh) = rated output (kW) × load fraction × annual operating hours ÷ motor efficiency.
Express efficiency as a decimal. A 94.5% efficient motor uses 0.945 in the calculation. If you already know actual shaft output, use that figure directly rather than multiplying rated output by a load fraction.
When the load changes, divide operation into representative bands—such as full production, reduced production, and idle running—and calculate each separately. Use the efficiency at each operating point, then add the results.
Do not treat current percentage as an accurate substitute for shaft-load percentage. Power factor and magnetizing current complicate that relationship. A suitable power analyzer can establish electrical input; estimating mechanical output requires additional measurements or a validated engineering method.
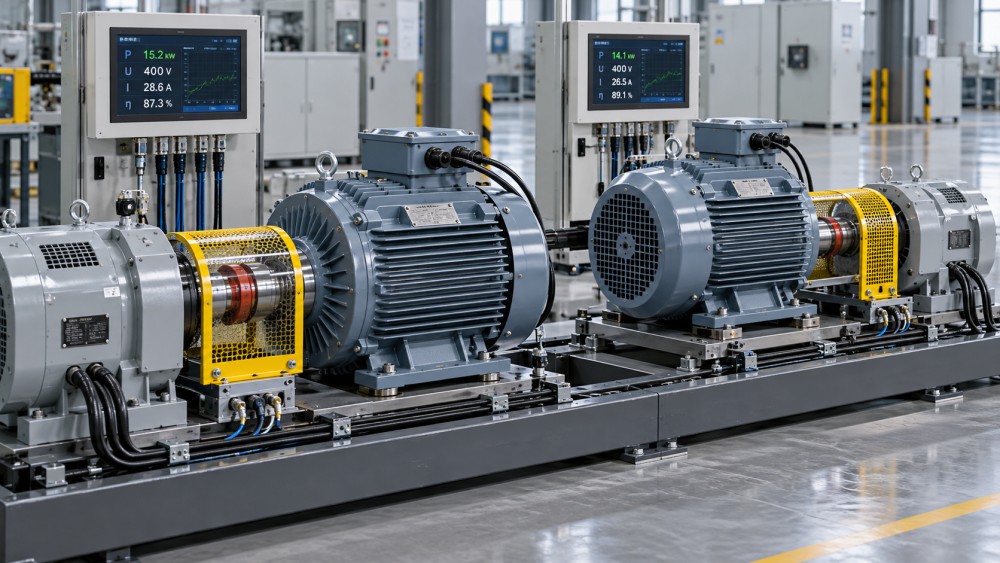
Check what the efficiency figure actually represents
Ask suppliers for efficiency data at relevant loads and speeds, using comparable test methods and operating conditions. An efficiency class is a useful screening tool, but it does not replace application-specific performance data.
For variable-speed operation, compare the motor-and-drive system. Drive losses, motor losses under inverter supply, cooling at low speed, and the operating profile all matter. Where combined efficiency data are available, avoid adding the same losses twice.
Pump and fan applications require particular care. Speed control can reduce system energy consumption substantially when process conditions allow, but the savings depend on the system curve, static head, control strategy, and required output. Keep motor-efficiency savings separate from savings caused by changing the process.
A worked comparison: does the efficiency premium pay back?
Consider two hypothetical motors serving the same constant-speed application. These figures illustrate the method; they are not product claims or market quotations.
- Rated mechanical output: 30 kW.
- Average shaft load: 75%, equivalent to 22.5 kW.
- Operating time: 6,000 hours per year.
- Electricity price: $0.12/kWh, excluding demand charges.
- Motor A efficiency at that operating point: 92.0%.
- Motor B efficiency at that operating point: 94.5%.
Motor B saves approximately 3,882 kWh, or $466, per year. Its additional installed cost is $900.
Simple payback = $900 ÷ $466 ≈ 1.9 years.
Over ten years, using a 6% annual discount rate and constant annual savings, the present value of energy savings is approximately $3,430. Subtracting the $900 premium leaves a net present benefit of about $2,530.
This calculation assumes equal maintenance, reliability, and residual value, with no replacement during the study period. If those factors differ, include them before deciding. Simple payback is a useful first check, but it ignores benefits after payback and the timing of future cash flows.
Include the costs that rarely appear on the quotation
Installation and drive integration
A replacement can require coupling changes, alignment work, new protection settings, cable modifications, or control-system adjustments. For inverter-fed motors, review insulation suitability, cable length, bearing-current risks, and any need for filters or insulated bearings.
Also check actual operating speed. A small speed difference can change the load on a directly coupled pump or fan. Comparing motor efficiencies while ignoring changed process output is not a like-for-like comparison.
Maintenance and repair
Estimate maintenance from the operating environment and service requirements, not from efficiency class alone. Bearing arrangement, lubrication access, contamination, vibration, and alignment all influence maintenance needs.
If repair or rewinding is an option, compare its cost, expected performance, service life, and turnaround time with replacement. Do not assume every rewind causes the same efficiency loss; outcomes depend on motor condition and repair practices.
Downtime and spare availability
A motor on a redundant ventilation system has a different failure consequence from one driving a production bottleneck. Estimate downtime using the expected failure frequency, restoration time, and actual economic impact.
Use lost contribution margin or another agreed measure rather than automatically treating all interrupted revenue as a loss. Include emergency labor, scrap, and restart costs where relevant, without double-counting them. A readily available spare may reduce restoration time more than a marginal change in efficiency improves annual energy cost.
Test whether the decision survives uncertainty
The best-looking result may depend on an optimistic operating schedule or electricity forecast. Run at least three scenarios: conservative, expected, and high-utilization.
Change the inputs most likely to affect the decision:
- Annual hours: will the equipment operate continuously, seasonally, or only during peak production?
- Load and speed: does the assumed profile reflect measured demand?
- Electricity price: are time-of-use periods, escalation assumptions, and tariff changes relevant?
- Service life: will the plant retain the equipment long enough to capture the savings?
- Reliability: how much do uncertain failure and repair assumptions influence the ranking?
In the worked example, reducing annual operation to 2,000 hours cuts annual energy savings to about $155, extending simple payback to roughly 5.8 years. The efficiency difference is unchanged; the investment case is not.
Demand-charge savings need separate treatment. Lower motor input reduces the electricity bill’s demand component only if it lowers the site’s billed demand under the applicable tariff. Likewise, improved power factor does not automatically reduce billed kWh, although it may affect reactive-power penalties or electrical-system losses.
Turn the calculation into a purchasing decision
Before approving a motor, ask for a short decision record: the required duty, installed quotations, measured or estimated load profile, efficiency evidence, tariff assumptions, study period, and discounted cost comparison. Note which uncertainties could reverse the outcome.
Keep carbon reporting visible but distinct from cash savings. Estimate emissions using an appropriate electricity emissions factor. Add a carbon cost only when an applicable charge or an explicitly adopted internal carbon price makes it relevant to the decision.
For power-equipment intelligence platforms such as GPEGM, the valuable connection is between engineering performance and commercial conditions. Motor and inverter developments, equipment availability, energy tariffs, and policy changes can inform assumptions—but site data should anchor the final calculation.
The strongest choice is not necessarily the cheapest motor or the one with the highest efficiency label. It is the option that performs the required job reliably and retains its lifetime-cost advantage when realistic operating conditions replace sales-sheet assumptions.
Related News
- Does a DC Motor Need a Separate Controller?Nov 02, 2026Does a DC motor need a separate controller? Compare brushed and BLDC requirements, explore control options, and learn how to choose the right setup for reliable performance.
- How Do I Compare Electric Motor Lifetime Costs?Oct 30, 2026How do I compare electric motor lifetime costs? Explore energy, maintenance, downtime, and payback with a worked example to make smarter motor purchasing decisions.
- How to size medium voltage industrial motors for high-inertia loadsOct 24, 2026Size medium voltage industrial motors for high-inertia loads with confidence. Learn how to check torque, acceleration, thermal limits and starting methods to avoid costly failures.
- Can Motor Drives Be Retrofitted to Existing AC Motors?Sep 27, 2026Can motor drives be retrofitted to existing AC motors? Learn key VFD compatibility checks, installation risks, energy-saving benefits, and retrofit best practices.
Related News
- 00
0000-00
How to assess a smart grid device manufacturer's interoperability - 00
0000-00
How to size a containerized energy storage system for peak shaving - 00
0000-00
How to use a global power matrix for procurement negotiations - 00
0000-00
Can an electrical grid platform integrate with legacy SCADA systems? - 00
0000-00
Can an electrical grid intelligence dashboard detect outages?