
The power electronics specifications that best predict long-term reliability are those connecting operating stress to a known failure mechanism: junction temperature and temperature swing, thermal resistance and transient thermal impedance, voltage stress margins, safe operating area, and power-cycling endurance. Capacitor lifetime ratings and cooling-system durability can be equally important at equipment level. Rated power and peak efficiency alone cannot establish service life.
The decisive question is not whether a converter stays below its absolute maximum ratings. It is whether its semiconductors, interconnections, insulation, and passive components can withstand the actual operating profile for the required service period. A useful reliability assessment therefore combines datasheet limits with application-specific stress calculations and qualification evidence.
Define the operating profile before comparing specifications
A continuously loaded industrial drive and a solar inverter can use similar power modules yet accumulate different damage. One may operate for long periods at a relatively stable temperature; the other may experience daily heating and cooling, changing irradiance, and intermittent high output. Their nameplate ratings do not capture those differences.
Translate the intended application into a mission profile: the electrical, thermal, and environmental conditions the equipment must survive over time. Include:
- Input-voltage range, DC-link variation, output current, overload duration, and switching frequency.
- Operating hours at different loads, start-stop frequency, and significant load transitions.
- Ambient or coolant temperatures, airflow restrictions, altitude, and expected cooling degradation.
- Humidity, condensation, dust, salt exposure, and vibration where relevant.
- Required service life, permissible downtime, and planned maintenance intervals.
Preserve the sequence of important operating events, not just annual averages. Ten minutes at high current followed by rapid cooling can impose a different fatigue burden from steady operation at the same average power. Likewise, a hot restart may produce stresses that a cold-start test does not reveal.
Read thermal specifications as a connected system
Maximum junction temperature is a ceiling, not a lifetime rating
The maximum junction temperature, Tj,max, establishes an operating boundary under specified conditions. It does not show how long a device will last near that boundary. A higher temperature rating may provide design flexibility, but it does not automatically make one device more reliable than another at the same operating point.
Estimate junction temperature using losses at realistic voltage, current, switching frequency, gate-drive conditions, and temperature. Room-temperature conduction figures alone are insufficient because conduction and switching losses change with operating conditions.
For a simplified steady-state calculation:
Tj ≈ Tc + Ploss × RθJC
Here, Tc is the case temperature at the specified reference location, and RθJC is junction-to-case thermal resistance. If the starting point is ambient air or coolant temperature, the calculation must also include the relevant interface, heatsink, and cooling-path resistances. Multi-chip modules may require thermal-coupling models rather than a single resistance.
Consider a hypothetical device dissipating 120 W with an RθJC of 0.20 K/W. Its calculated junction-to-case rise is 24°C. That result says nothing about the case temperature, which still depends on the complete cooling system. Comparing thermal resistance without comparing losses and boundary conditions can therefore produce the wrong selection.
Transient thermal impedance determines short-duration temperature peaks
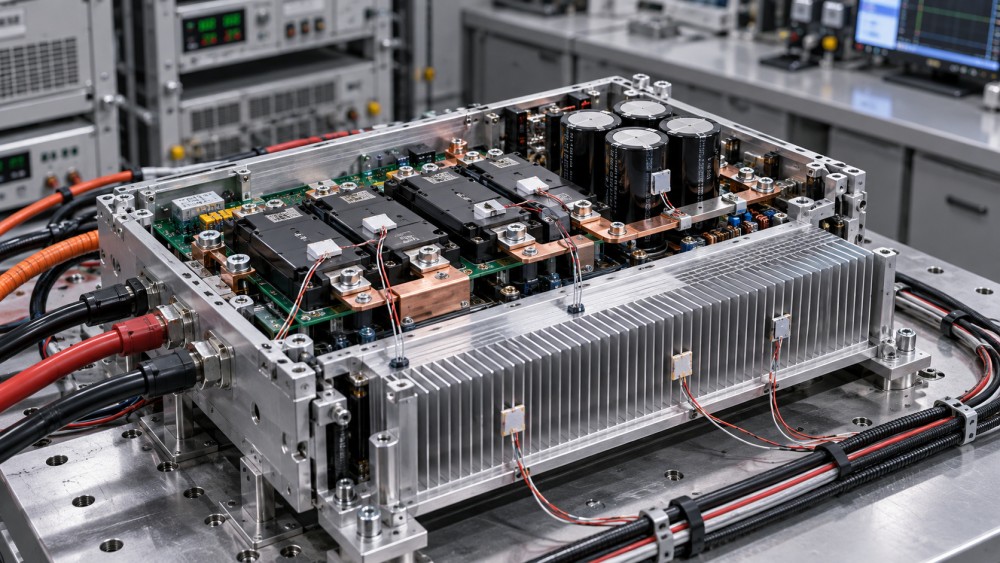
Steady-state thermal resistance cannot adequately describe acceleration pulses, repetitive overloads, or intermittent operation. Transient thermal impedance, Zθ(t), describes the thermal response over time. Use it with the actual pulse duration and repetition pattern to estimate peak junction temperature and temperature swing.
Check whether the published curve represents a single pulse or repetitive pulses, and whether it is normalized. A thermal network supplied for simulation can improve the calculation, but its boundary conditions must match the installation. Model detail does not compensate for an incorrect case-temperature assumption.
Thermal-interface material, mounting pressure, surface flatness, and assembly torque also affect the result. A low module thermal resistance offers limited benefit if the installed interface develops voids or loses performance during cycling.
Use power-cycling data to evaluate fatigue—not just temperature limits
Repeated expansion and contraction can damage bond wires, solder layers, and other package interconnections. For these mechanisms, the junction-temperature swing, ΔTj, and the temperature level around which cycling occurs matter alongside peak temperature.
Power-cycling endurance is therefore valuable evidence, but a headline cycle count is not independently meaningful. A comparison requires the test conditions:
- Minimum and maximum junction temperatures, or temperature swing and mean temperature.
- Heating and cooling durations and the method used to generate the cycles.
- Test current, package construction, and cooling arrangement.
- Failure criterion, sample size, and statistical treatment.
Active power cycling heats the semiconductor through electrical losses. Passive temperature cycling changes the surrounding temperature and can stress different parts of the assembly. Results from these tests are not interchangeable, even when both are expressed as “cycles survived.”
For a lifetime estimate, convert the mission profile into temperature-cycle populations and apply a fatigue model supported by relevant test data. Cumulative-damage calculations can help compare designs, but their accuracy depends on the model’s applicable range and assumptions about damage accumulation. Extrapolating far beyond tested temperatures or cycle durations should not be presented as a demonstrated service life.
For equipment with frequent load changes, a well-supported power-cycling curve can be more informative than a small difference in maximum current rating. For nearly constant-load operation, sustained temperature and other aging mechanisms may carry greater weight.
Check voltage margin against actual transients
A semiconductor’s blocking-voltage rating must accommodate more than the nominal DC-link voltage. Include maximum supply tolerance, regenerative operation, switching overshoot, and relevant abnormal conditions. Stray inductance and switching speed influence the peak voltage at the device terminals.
There is no universal derating percentage that establishes reliability across all converter designs. The required margin depends on topology, transient control, device technology, insulation coordination, and the application’s consequences of failure.
Ask for voltage waveforms measured under demanding combinations of bus voltage, current, temperature, and gate-drive settings. A nominal-load trace cannot demonstrate adequate margin during a high-current turn-off event. Measurement bandwidth and probe arrangement also matter because an unsuitable setup can distort fast transients.
Do not treat avalanche capability as permission for routine uncontrolled overvoltage. Where avalanche operation is intended, its repetitive limits and thermal implications need explicit support from the device manufacturer. A single-pulse energy rating does not establish repetitive endurance.
At assembly level, semiconductor voltage margin does not replace insulation assessment. Working voltage, creepage, clearance, material properties, pollution conditions, and altitude must suit the installation. Partial-discharge evidence is relevant where the insulation system and operating voltage make it an applicable concern.
Interpret safe operating area together with protection timing
The safe operating area (SOA) defines permitted combinations of voltage, current, and time under stated conditions. It is more useful than an isolated current rating when evaluating startup, overload, fault interruption, or operation involving simultaneous high voltage and current.
Check the temperature and pulse conditions behind each SOA curve. A limit specified at a low case temperature may not apply to a hot converter. Likewise, a pulsed current rating does not establish continuous-current capability or suitability for linear-mode operation.
For switching applications, reverse-bias SOA and short-circuit withstand information can be important, depending on device type and topology. Short-circuit withstand time is a protection-design constraint—not a general reliability score. Its usefulness depends on specified bus voltage, gate voltage, initial junction temperature, and fault conditions.
The total fault-clearing interval must include sensing, blanking, filtering, logic delay, driver propagation, and device turn-off. Turn-off must also avoid excessive voltage overshoot. A device with a stated withstand capability provides little reassurance if the complete protection chain has not been validated under comparable conditions.
Wide-bandgap devices require the same discipline. Faster switching can reduce some losses while increasing sensitivity to layout, gate-loop behavior, and voltage transients. A silicon carbide or gallium nitride label is not, by itself, reliability evidence.
Look beyond the semiconductor
A converter can have conservative junction temperatures and still suffer early failure because its capacitors or cooling components are unsuitable for the duty. Equipment-level reliability requires checking the parts whose aging or wear can limit service life.
A capacitor endurance rating is not a direct promise of equipment lifetime. For aluminum electrolytic capacitors, temperature-based life calculations must account for ripple heating and the manufacturer’s assumptions. A simple temperature-doubling rule should not be transferred indiscriminately between capacitor technologies or operating regimes.
Cooling redundancy also needs examination. Two fans do not provide useful redundancy if one failure leaves the remaining fan unable to maintain acceptable component temperatures and no timely derating or shutdown occurs.
Separate qualification evidence from lifetime claims
Qualification tests show whether samples meet defined acceptance criteria after specified stresses. They support reliability assessment, but passing a test does not automatically demonstrate a particular field lifetime.
JEDEC semiconductor test methods and IEC 60068 environmental tests provide recognized frameworks for relevant testing. Their value depends on the exact method, severity, duration, sample population, and acceptance criteria. Similarly, conformity with an applicable safety standard, such as IEC 61800-5-1 for adjustable-speed drive systems, does not by itself establish a wear-out life.
Request evidence tied to the offered construction: package materials, interconnect design, capacitor series, cooling arrangement, and manufacturing revision. A report for a different module family or an earlier assembly may not address the current product’s failure mechanisms.
Treat MTBF claims separately from wear-out life. A predicted MTBF based on component failure-rate models is not the expected replacement age, and it cannot be converted directly into a service-life guarantee. Field-return data can add useful evidence when the installed population, operating exposure, failure definition, and reporting coverage are disclosed.
Make the comparison on a common operating basis
Require competing designs to be evaluated against the same mission profile, cooling conditions, overload requirements, and end-of-life criteria. Compare calculated peak junction temperature, temperature-cycle exposure, measured voltage stress, protection margin, and the modeled life of limiting passive components—not just datasheet maxima.
Keep calculated margins, qualification results, and field evidence distinct. Where a lifetime estimate is sensitive to uncertain inputs, examine credible hot-ambient, cooling-degradation, and high-load scenarios rather than relying on a single nominal result.
The stronger reliability case is the design whose important failure mechanisms are identified, whose stresses remain controlled throughout the required duty, and whose supporting evidence matches the supplied hardware. A higher rating is useful only when it creates demonstrable margin under those conditions.
Related News
- How to size a containerized energy storage system for peak shavingNov 04, 2026Size a containerized energy storage system for peak shaving. Learn to assess load data, demand charges, battery capacity and costs for a reliable project.
- Can an electrical grid platform integrate with legacy SCADA systems?Nov 02, 2026Can an electrical grid platform for utilities integrate with legacy SCADA? Explore protocols, cybersecurity and pilot steps to reduce risk and protect reliability.
- Can an electrical grid intelligence dashboard detect outages?Nov 01, 2026Can an electrical grid intelligence dashboard detect outages? Explore the data, detection methods, and essential tests that reveal how reliably it identifies power interruptions.
- How to select a circuit breaker for switchgear based on fault currentOct 31, 2026Choose the right circuit breaker for switchgear by evaluating fault current, interrupting capacity and coordination. Explore the essential checks.
Related News
- 00
0000-00
How to assess a smart grid device manufacturer's interoperability - 00
0000-00
How to size a containerized energy storage system for peak shaving - 00
0000-00
How to use a global power matrix for procurement negotiations - 00
0000-00
Can an electrical grid platform integrate with legacy SCADA systems? - 00
0000-00
Can an electrical grid intelligence dashboard detect outages?